Introduction
ELAINE uses symbolic logic to analyze documents, performs context and semantics analysis in seconds, and renders a set of interactive reports that articulate the key focus, relevancy, abstraction, knowledge maps and hierarchical index to abstractions and excerpts. With these interactive reports, one can navigate by breath, depth, abstraction or relationship to understand the context and semantics. It simplifies complex scenarios into bite-size, easy-to-consume insight. ELAINE is a cloud platform.
The ELAINE process
Input: Submit a problem narrative to ELAINE for analysis
- Discover Context
- Discover stories
- Determine stories as declarative or imperative in nature
- Organize stories by relevancy
- Draw relationships between stories
- Create abstractions from stories to support creative thinking and design thinking
Output:
- Abstraction of stories organized by relevancy
- Knowledge map depicting relationships between stories
- Logical report summarizing stories by topics and abstractions
- Highlight stories with tailwind and declarative potentials
- Highlight stories with headwind and declarative potentials
- Highlight stories with work-in-progress or imperative in nature
Example of an ELAINE analysis:
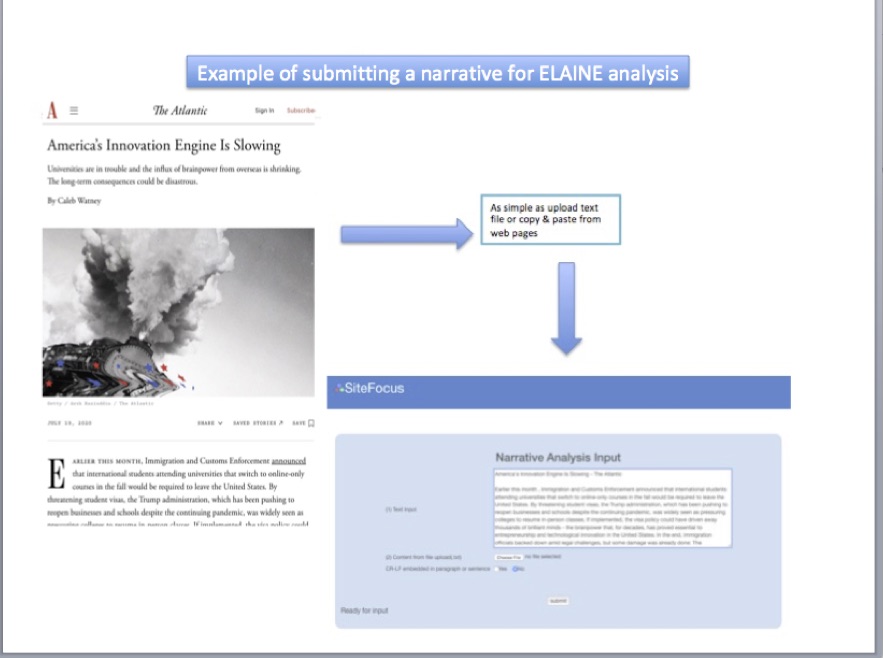
Step1: Submit Narrative to ELAINE for real-time analysis
⇒ You can copy and paste narrative to ELAINE
⇒ or upload a .txt file as input
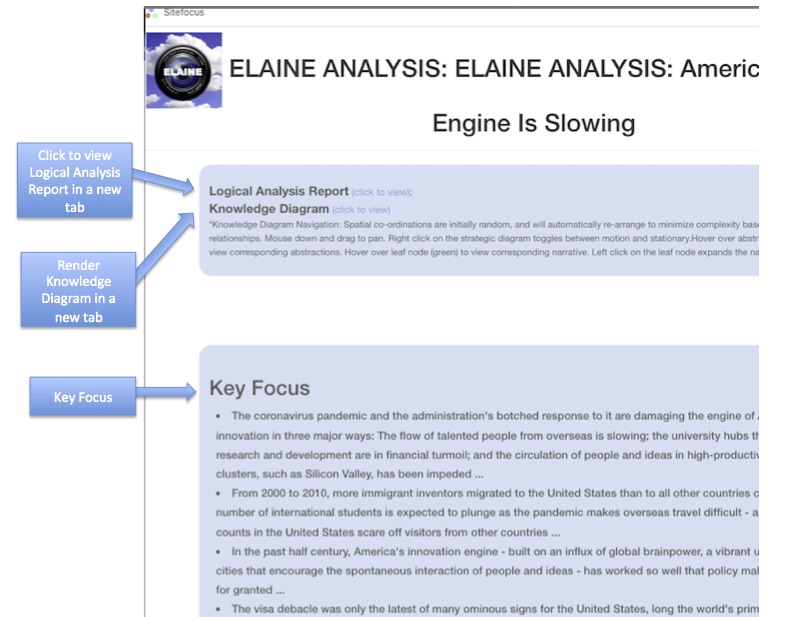
Step2: Within seconds, ELAINE produces the following output for every narrative automatically
This report is comprised of several sections:
Links to auxiliary reports - "Logical Analysis Report" and "Knowledge Diagram"
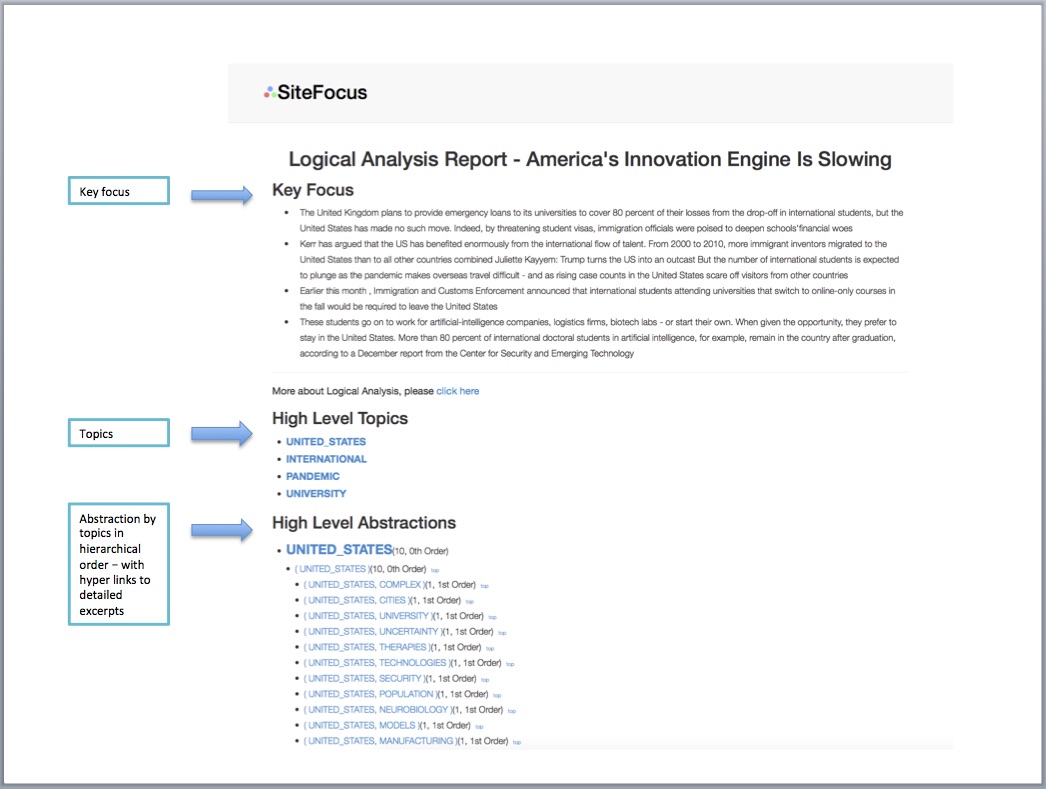
Key focus - key takeaway of narrative
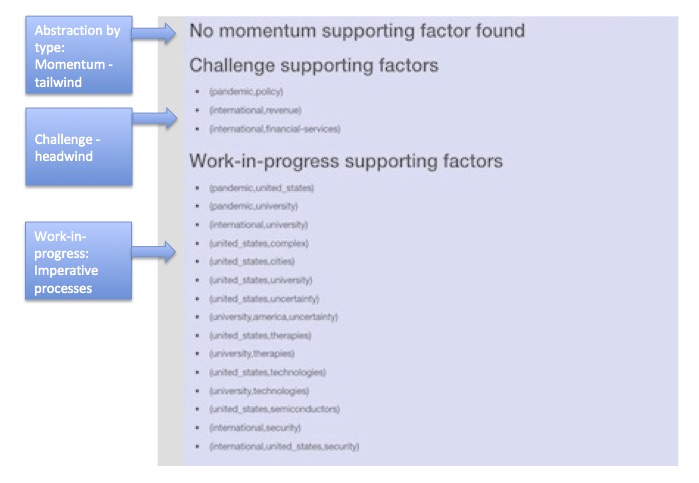
Groups of abstractions presented in three categories - momentum (tailwind), challenges (headwind), and work-in-progress (imperatives)
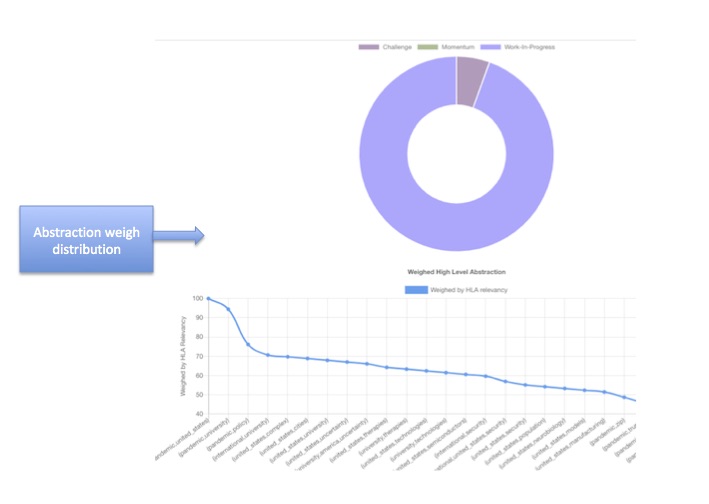
A donut graph showing the proportion of content according to the categorization of abstraction
A line graph showing abstractions weighted by relevancy
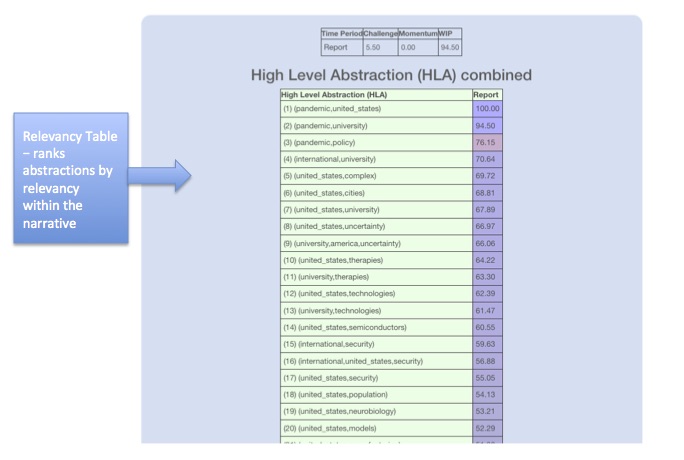
A table of abstractions ordered by relevancy
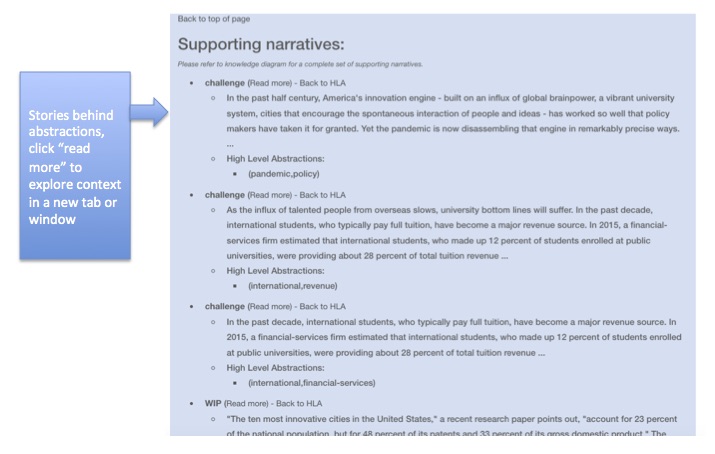
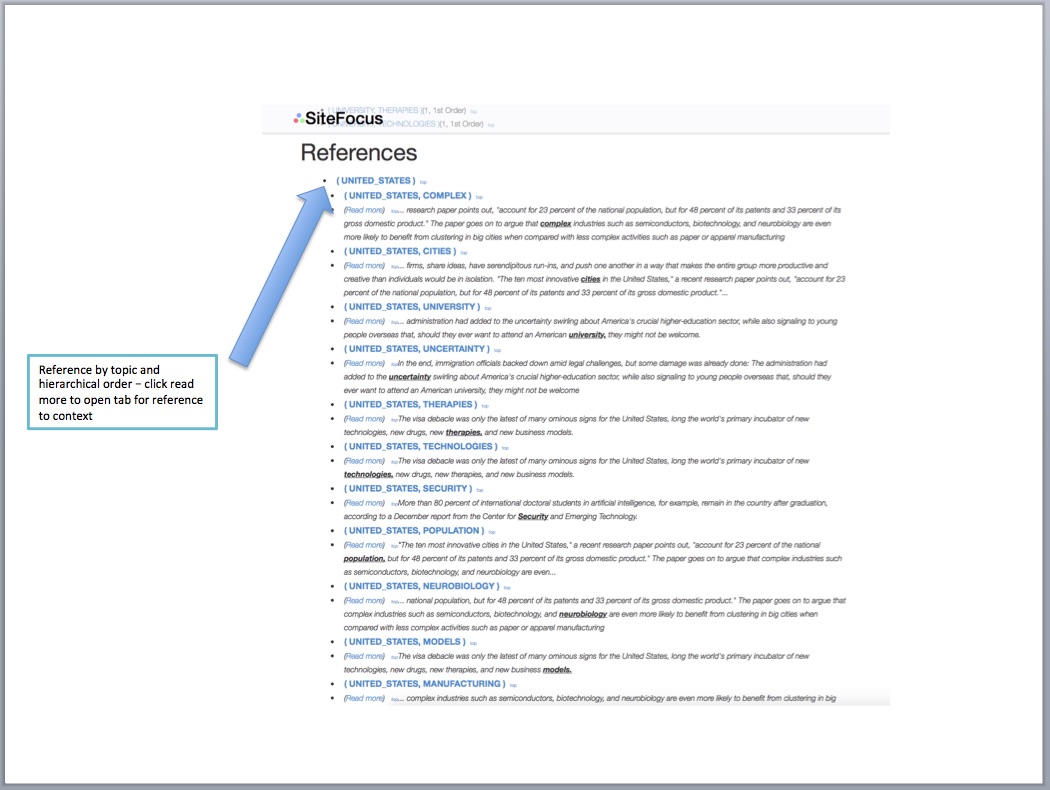
A list of abstractions with corresponding excerpts
Logical Analysis Report
ELAINE's "Logical Analysis Report" organizes its abstractions and tells the stories in detail - brings out the author's point of view and inspires creative thinking. It can be compared to a book index, a roadmap to the narrative. It presents index to abstraction in relevancy order. Each of the abstractions shown in the index is a hyperlink to the corresponding excerpt. This link enables instant deep dive into details. The "read more" hyperlink brings up a new window that highlights the excerpt within the input text.
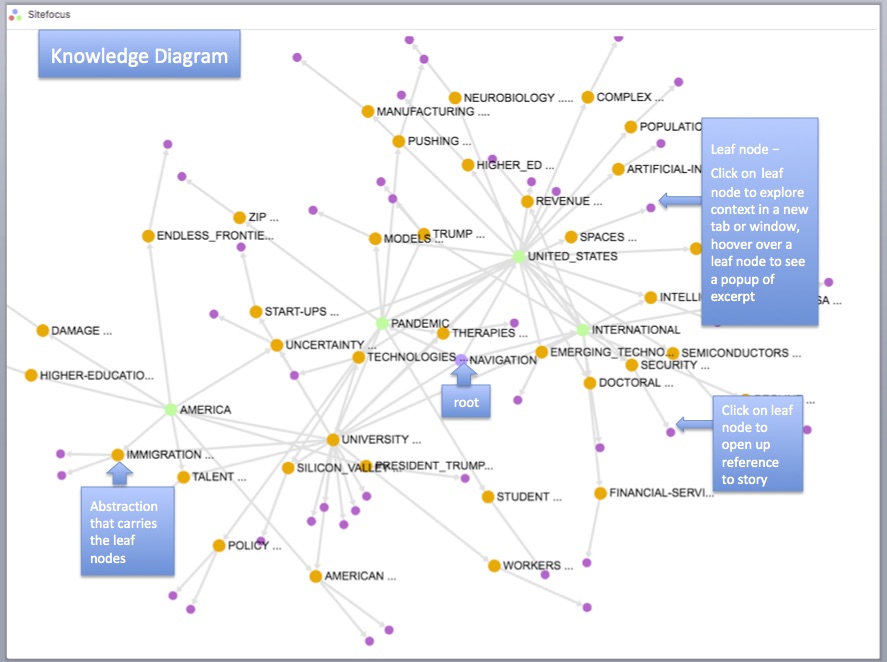
Knowledge Diagram
The knowledge map is a topological representation of the nexus on symbols used in abstractions, connecting the dots for user navigation and exploration. The top node of this topology is named "NAVIGATION". "Child" nodes linking to "Navigation" are the top level symbols that corresponds to the high level topics. The edges connect symbols that are shared among abstractions. Higher level symbols are in green color.
Navigation
Spatial co-ordinations are initially random, and will automatically re-arrange to minimize complexity based on distance between relationships.
Mouse down and drag to pan. Right click on the strategic diagram toggles between motion and stationary.
Hover over abstract node (orange) to view abstractions.
Hover over leaf node (pink) to view corresponding narrative.
Left click on the leaf node expands the narrative to view full text.
Visit SiteFocus.com to view more examples of ELAINE analysis